Folks,
Many of us are fascinated by the presidential electron this year. Some may also wonder what is meant by the "margin of error" in the poll numbers that are discussed on a daily basis.
The statistics of polling is described by the binomial distribution. This distribution was developed to describe data that are yes/no, heads/tails, true/false, candidate A/candidate B, etc. The either/or nature of the data is what is called a Bernoulli trial.
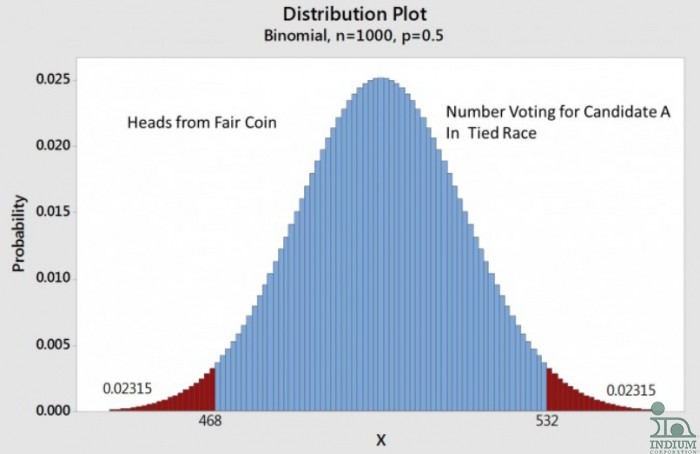
As an example, let’s assume you flip a fair coin 1,000 times. The most likely number of heads would be 500, but you wouldn’t be surprised if you got 492 or 507 heads. You would certainly be surprised if you got only 200 heads. The figure below shows the binomial distribution for this situation.

Figure: About 95% of the time, flipping a fair coin 1000 times will result in between 468 and 532 heads.
Note the area below 468 or above 532 is red, those areas are statistically significant in that there is only a 5% chance that you would get either below 468 or above 532 heads. There is a little rounding error so the actual number is 4.63 %, a little less than 5%.
So, about 95% of the time you flip the coin 1,000 times, the number of heads will be between 468 and 532. The world has settle on this “95%” as the criteria for statistical significance. So the number of heads will vary about +/- 3.2% (32 above or below 500, divided by 1,000) 95% of the time you perform the 1,000 flips. This +/- 3.2% is the “margin of error,” also denoted the MOE.
Now let’s relate this to polling in the presidential election. The pollsters make every effort to poll a sample of people that represents the nation. This is no trivial task. But, assuming that they do get a fair sample, even in a 50/50 race, just like flipping a coin, they will not necessarily get a 50/50 sample. Their results will be just like the coin toss, 95% of the time they will get from 468 to 532, even in a 50/50 race.
Most polling shows a MOE of about 3%, so we know that the sample size is about 1,000.
Cheers,
Dr. Ron

