Folks,
Let’s see how Patty is doing after teaching her first class at Ivy U…
Patty arrived at home after teaching her first class at Ivy U and she couldn’t contain her excitement. For the next couple of hours her husband, Rob, had to politely listen to her talk about how amazing it was to teach the young, bright, enthusiastic, future engineers.
Time went quickly and, before she knew it, she was standing in front of the class for her second lecture.
Patty reviewed quickly the fact that it was incorrect to average Cpks and that, to calculate a Cpk, the data should be normally distributed.
“The question was asked last time, how one can tell if the data are normal? Minitab® can be used to plot the data on a normal probability plot. By eye, we can get a good sense if the data are normal or not. In addition, Minitab will perform various tests, one of them being the Anderson-Darling Normality Test,” Patty began.
“Let me show you some real data to demonstrate this,” Patty continued.
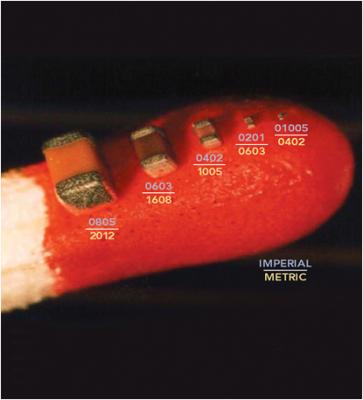
“When assembling a smartphone like the new Druids, the mechanical tolerances for the many tiny capacitors and resistors are very precise. One common capacitor size is only 0.6 mm long..,” Patty paused as she saw a student’s hand raised.
“Yes, Martin?” Patty asked.
“Professor, you mean 0.6 cm right?” Martin asked.
“No, 0.6 mm,” Patty answered.
Patty’s answer caused quite a bit of murmuring, finally Patty had to ask for order.
“Why is everyone surprised?” Patty asked.
“Professor, that is much smaller than a grain of rice, it is more like the size of a grain of sand,” Alison March responded.
“This is fun,” Patty thought, “and good timing.”
Patty showed a slide of passives on a match head and passed around a teardown of Druid smartphone with a magnifying glass so that the students could see how small the passives were.
It took a while for the class to calm down.
Patty then said, “And about 200 to 500 capacitors and resistors of this size are individually placed and soldered in the electronics assembly process in each smartphone.”
The student’s mouths were agape.
“OK, let’s discuss how these little rascals relate to SPC. My company orders billions of these electrical components each year. We are sent a sample lot to approve a larger order. For the components of interest, we already know that the mean length is 0.6mm, the 3 sigma (standard deviation) tolerance is +/-0.03mm. So, the lower spec limit is 0.57 mm and the upper spec limit is 0.63mm. This equates to a Cpk = 1.00,” Patty went on.
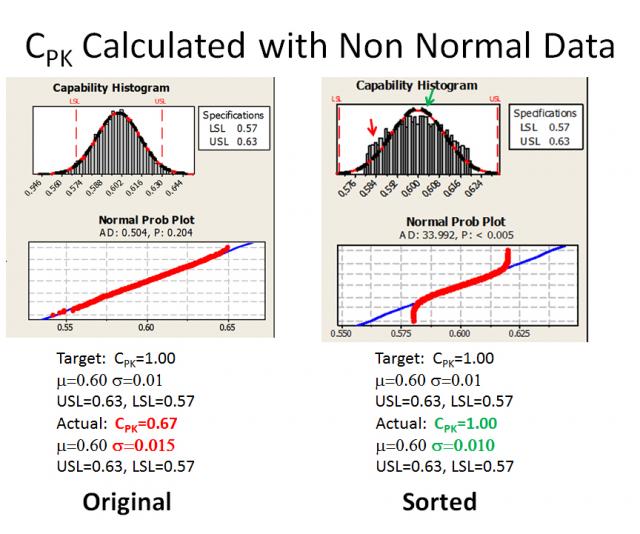
Patty put a PowerPoint slide up that showed the data.
“The data for the sample lot is on the left. What is the problem?” Patty asked.
Charles Parsons raised his hand.
“Yes, Charles?” Patty asked.
“Well, Dr. Coleman, the standard deviation for the data is 0.15 and the resulting Cpk is only 0.67, so the targets are not met” Charles answered.
“Precisely,” Patty replied.
“We then went back to the supplier and asked them to fix the problem. The graph on the right is from the capacitors they sent us 3 weeks later, after they claimed to have solved their manufacturing process problems,” Patty explained.
“What do you think?” Patty asked.
There was a lot of murmuring. Finally DeShaun Martin raised his hand.
“Yes, DeShaun?” Patty acknowledged him.
“Well, Professor, it looks like they simply sorted out the parts to make the sigma lower and Cpk higher,” DeShaun responded.
“Precisely,” Patty said.
“I don’t see what is wrong with sorting,” Sandy Lisle commented.
“You see from the Druid smartphone that I passed around that it is so densely packaged with components that there is hardly any room in it. To achieve this density we have to perform tolerance analyses to assure everything will fit. In all of these analyses we model with normal distributions. With a sorted distribution we will likely have more tolerance interferences,” Patty answered.
“Look at the red arrow. There will be an excess of components with this size and a lack of components of the size where the green arrow is pointing. These differences will cause some tolerance interferences with the pads on the printed wiring board where the passive will be assembled,” Patty continued.
“Can you review? How we can tell that the distribution on the right is not normal?” Conor Stark asked.
“Sorry, I almost forgot. Look at the normal probability plot for the sorted data. Note how it diverges from the straight line on the ends. Also the Anderson-Darling value for p is <0.05. These two criteria are cause to reject the hypothesis that the data are normal," Patty finished.
Patty was just wrapping the class up when someone raised their hand.
“Yes, Natalie?” Patty asked.
“What was the final outcome?” Natalie asked.
Patty chuckled, obviously she should share he result of this adventure.
“Oh, yes. We could not use the parts for the Druid smartphones, but they were OK for some toys we were assembling. In addition we insisted on a 30% discount, since the passives did not meet the specification,” Patty answered.
As she was cleaning up, two of the female students came up to Patty. One them, Justine Randall spoke for the two.
“Professor Coleman, you are an inspiration for us. We hope in twenty years we can be just like you,” Justine said with emotion.
Patty was indeed touched, but as she left the classroom, she decided that she had to start dyeing her hair.
Cheers,
Dr. Ron


