Patty, Rob, and Pete were quite sure they understood the confusion in the Cpk = 1 issue, but wanted to make sure they discussed it with the Professor. After a brief chat with him, they called ACME CEO Mike Madigan from The Professor’s office.
“Professor, it’s great to speak with you again,” Madigan began.
The all exchanged pleasantries, with the Professor thanking Madigan for his financial support of Ivy U through the ACME Corporation. In a few moments the discussion turned to the Cpk = 1 issue.
“Tell me what you amazing intellectuals have figured out,” Mike chuckled.
“We all thought the article that the vendor referred to had a great discussion on statistical process control (SPC)”, Patty began.
“We especially liked the discussion on the difference between a process being in ‘control’ and ‘capable,’” Rob added.
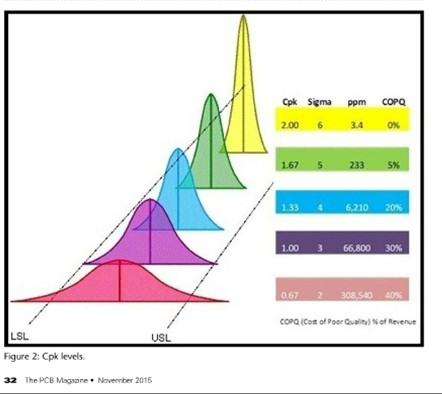
“But, what about 66,800 ppm equals a Three Sigma process?” Mike implored.
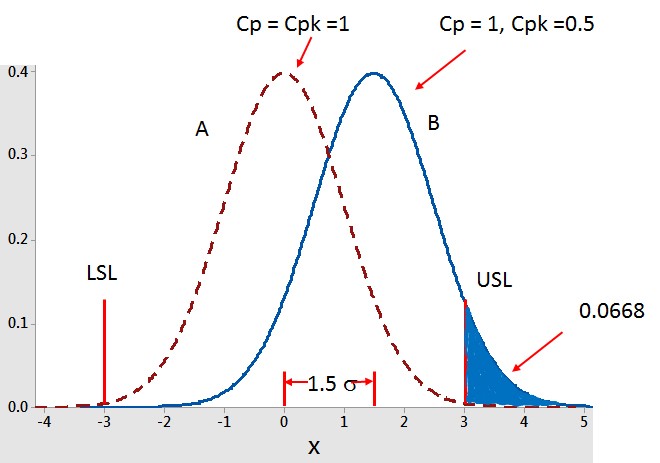
“As we know, Motorola started the 'Six Sigma' movement,” the Professor began. “They defined ‘Six Sigma’ quality has having a Cp of 2 and a Cpk of 1.5. True mathematical Six Sigma is Cp=Cpk=2. Their definition, with a Cpk = 1.5, allows for a shift in the mean of 1.5 Sigma. The adage that ‘Six Sigma’ equals 3.4 ppm defects comes from this definition. Because of this shift, most of the defects are on one side of the distribution. By the way, true mathematical Six Sigma is about 2 defects per billion,” he went on.
“It seems a little like cheating to me,” Madigan added.
“Me too. I think they wanted something sexy sounding, like ‘Six Sigma,’ but knew they couldn’t really achieve less than 2 ppb defects, so they created the 1.5 sigma shift of the mean,” Pete chimed in.
“I’m sure that others agree with Pete, but that is where the world of ‘Six Sigma’ is. Unfortunately, it can create confusion - as in the case at hand,” the Professor responded.
“So how does it relate to the 66,800 defects per million equaling a Cpk of 1 and a Three Sigma process?” Mike asked.
“Pete has done the most work on this. Let’s let him answer,” the Professor suggested.
“If you apply the 1.5 Sigma shift of the mean to process capabilities, we get the table below,” Pete said.

Note that the Cpk level for 66,800 dpm is 0.5 not 1 and the true process level is not Three Sigma, but 1.5 Sigma. Admittedly the Cp level could be 1, but Cpk is a precise calculation and the graph from the paper in question (reprinted below) has it wrong. The values they list for Cpk are the Cp values. This is the mistake your vendor made by using this chart. ” Pete said.

“The graph below shows the situation for the vendor. Distribution A has a Cp and Cpk =1, where as distribution B has a Cp = 1, but a Cpk of only 0.5. The 1.5 Sigma shift for B is also shown. The vendor's data are similar to B, with its the 66,800 dpm.. It is improtant to note that Cp alone tells nothing about the defect level,” Pete went on.

“Pete, please tell Mike about the spread sheet you made,” Patty suggested.
They had signed onto Webex®, so Pete gave a limit demo.
“By entering the spec limits, as well as the mean and sigma of the data, it will calculate Cp, Cpk, the sigma limit of the process, and the process dpm,” Pete said.

“Oh, and you can enter the dpm and it will estimate the Cpk and process sigma level,” Pete went on.
“Quite impressive,” Madigan summed up. “I assume it is OK if my team uses it?” he went on.
“Sure,” Pete said, beaming a little.
Math was never Pete’s strong suit. But, being at Ivy U, he had recently taken a statistics and calculus class. He had a strong sense of accomplishment after creating this useful spreadsheet.
For those that would like a copy of Pete's spreadsheet, send me an email at rlasky@indium.com.
Cheers,
Dr. Ron


