Let’s look in on Patty and the team……
Several weeks ago…
It was just before Christmas and Patty was heading in to Ivy U from her home in Woodstock, VT. Just as she passed the library, she saw the Woodstock HS band playing Christmas carols. Luckily, there was a parking spot nearby. So, she stopped her car and got out to take a video with her iPhone 6S to show Rob and the boys. After a few minutes of recording, she went to put the phone away, but her fingers were cold and she dropped it on the frozen cement. The phone was christened with its first dent. Patty groaned. In their quest to make the thinnest phone, Apple made it impractical to hold without a tactile cover.
Today….
Patty was rushing to her office as she had a meeting with Pete. His text made it sound urgent.
As she was almost there, she checked her Fitbit® Charge and Apple Watch. She was comparing their fitness apps for a lecture she was giving in ENGS 1 “Everyday Technology” at Ivy U. It appeared the Fitbit gave more accurate step counts; the Apple Watch would miss more steps that were not vigorous and it did not count flights of stairs. However, the crystal on the Fitbit had recently developed a scratch (the crystal wasn't sapphire?) and she wondered if the $150 cost was reasonable for a device that did not have a lot of functions. Admittedly, the Apple Watch cost about $350 or so, but it could do so many things.
As Patty approached her office, Pete was sitting outside, looking stressed.
“What’s up?” Patty asked.
“I just got an email from Mike Madigan asking more questions about Cp and Cpk,” Pete replied.
“That shouldn’t be a problem,” Patty responded.
“No. But me giving a lecture on Cp and Cpk is,” Pete said with a worried look.
“You’ve been talking up my work on these topics, and my Excel® spreadsheet, so much that Professor Walters asked me to discuss all of this in his statistics class,” Pete went on.
“And the problem is?” Patty asked.
“I’m afraid to speak in front of a group of people,” Pete confessed.
Patty paused. As much as they had worked together, she had never seen him speak to a group. They spent the next 10 minutes developing a plan to help Pete over this hurdle.
“Can you handle talking to Mike alone?” Patty changed to subject.
“Sure! That I can do,” Pete shot back.
Pete went to his office and re-read Mike’s email.
Pete, thanks for your Excel spreadsheet Re Cp and Cpk. One thing we don’t understand is the difference between one-sided or two-sided defects. Can you call and chat about it? How about today at 4PM? Best, Mike.
Pete used Minitab® to develop some graphs that explained the difference between one-sided and two-sided defects. By lunchtime he was prepared for his telecon with Mike. The rest of the day went quickly as he had several meetings with students right up until his 4PM call.
At 3:59 PM, Pete dialed Mike’s number.
“Hey, Pete! Thanks for calling. Our team is impressed with your Cp and Cpk spreadsheet, but we don’t understand the difference between single-sided and double-sided defects. Can you make this clear to me?” Mike began.
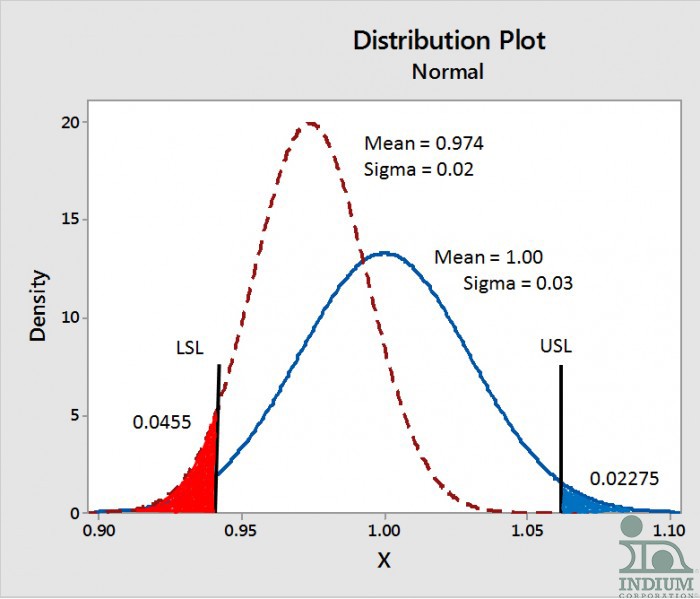
“Sure. Take a look at the PowerPoint® slide I sent you. It shows distributions for two samples of bores. The spec is 1.00mm +/- 0.06mm. Typically, we expect the spec to be at a 3 Sigma limit, so Sigma should be 0.02mm. Note the one distribution has a mean at the center (1.00mm) but the Sigma is 0.03, higher than desired. The other distribution has the desired sigma of 0.02mm, but the mean is shifted to 0.974mm,” Pete began.

Figure: The PowerPoint® slide Pete sent to Mike. Note: for the off-centered distribution, all of the defects are below the LSL. Whereas, for the centered distribution, the defects are equal on both sides of the spec limits. The total defects are the same for both distributions.
“So, the one curve has the right sigma of 0.02mm, but is off center,” Mike commented.
He paused for a little and then added, “And the other curve is centered but has a larger sigma of 0.03mm.”
“Notice that all of the defects on the off-centered curve are on the low side of the spec or the lower spec limit (LSL) shown in red. Whereas, the defects on the centered curve are on both sides,” Pete continued.
“Yes. And I’m going to guess that the off-centered curve is worse, even though the sigma is lower,” Mike added.
“Yep. The defect rate for both is 0.0455. But, the off-center curve is worse in a manufacturing situation,” Pete responded.
“But, why is that, if the defect rate is the same?” Mike asked.
“Well, let’s say some shafts are to go into the bores. Say the shafts have a mean diameter of 0.92mm +/- 0.06. Most tolerance analysis assumes a centered distribution. The off-centered distribution of bores will have 2.8% interference fits, whereas the centered distribution will have only 1.3% interference fits, even though the sigma is 0.03mm for this distribution,” Pete elaborated.
“So, stacking all of the defects at one end can be a problem? Let me guess that the Cpk for the centered distribution is better,” Mike responded.
“Yes. The Cpk for the centered distribution is 0.667 and for the off centered distribution is 0.565. The Cpk really gives the best information about the data,” Pete concluded.
“How did you calculate the interference fits?” Mike asked.
“Another Excel spreadsheet,” Pete chuckled.
“So, the bottom line is that Cpk is king, right?” Mike asked.
“Right,” Pete agreed.
Epilogue:
Patty helped Pete prepare his lecture for the statistics class, which included a dry run. Pete’s lecture was a big success, and although he was nervous at the start, he quickly became comfortable.
Cheers,
Dr. Ron


