Folks,
Let's check in on how Patty is doing at Ivy U.
Patty was nearing the end of her teaching stint at Ivy U. Only a few more classes remained. She had to admit that she was sad to see this adventure end. Oh, well, such is life.
The syllabus allowed for the last few lectures to cover “Selected Topics,” so Patty decided that her selected topics would be Weibull Analysis. She felt passionately that all engineers should have some exposure to failure analysis and this topic fit right in to engineering statistics.
Before she knew it, she was heading north up to Ivy U for her next-to-the-last lecture. She thought she should soak in the beauty of the campus as her car approached, for soon this would be her last time at Ivy U for a while. Today she was lucky, she found a parking spot right away.
As she walked into the main engineering building, she noticed a note in her mailbox. It was from Dean Howard. She quickly opened it. He was requesting a brief meeting after her last class.
“Yikes!” thought Patty, “Dean Howard wants to see me! I wonder if it’s serious. Did I goof up, somehow?"
She would have to wait for two days to find out what the Dean wanted and she couldn't worry about it now, as her class was starting in 10 minutes.
Patty began the class by explaining the development of Weibull’s theory and gave a few examples. She showed where the scale factor and slope came from. Patty emphasized that a steep slope indicted a tight distribution of data (a good thing for prediction from the data) and that a larger scale suggested a longer mean life. She then discussed the importance of different types of tests in electronics, such as thermal cycle testing and drop shock testing. As an example, she thought she would share some accelerated thermal cycle data for two different alloys that are used in electronics assembly.
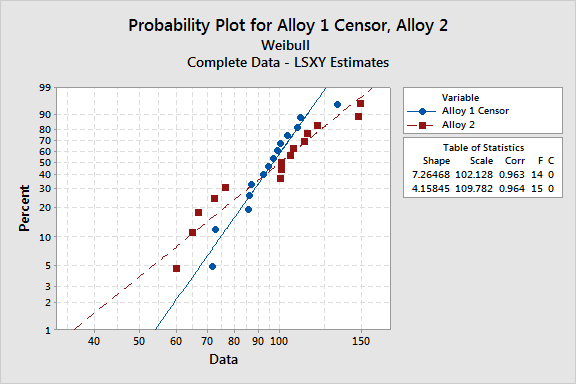
She showed the first set of data in a PowerPoint slide (Figure 1).
Figure 1.
“Can someone explain these results to me?” Patty asked.
After some murmuring, Karen Armstrong raised her hand.
“Yes, Karen," Patty responded.
“It appears that Alloy 2 demonstrated superior performance, as seen in its much steeper slope and slightly better scale,” Karen answered.
“Nice job, Karen,” Patty responded.
“What about this one point?” Patty asked as she pointed to the obvious outlier for Alloy 1.
There was more murmuring, but no one raise their hand. So Patty showed a slide with the outlier removed. (Figure 2.)
“I have removed the outlier because failure analysis showed it was atypical,” Patty said.
Figure 2.
“As you can see, now alloy 1 has a slightly better slope. This suggested a tighter distribution and hence more ability to predict performance,” she went on.
There was now very loud murmuring, finally Scott Bryzinski raised his hand.
“Yes, Scott?” Patty responded.
“Professor, it just seems like cheating, dropping a bad data point because you claim it is not representative of the other samples,” Scott explained.
There were many loud echoes of agreement.
Patty chuckled a little.
“OK, OK, you are right. It is not fair to censor a data point in most cases. This is part of the lesson of this class. Don't censor data lightly,” Patty said.
“Let’s look at data for Alloy 3 and 4,” Patty went on. See Figure 3.
Figure 3.
The students looked at the data for some time and finally Diane Pompey raised her hand.
“Yes, Diane,” Patty acknowledged.
“They look about as dead even as one could expect, except that the sample sizes are different. Alloy 3 has 15 samples and Alloy 4 only 13 samples, as can be seen in column ‘F’ in the ‘Table of Statistics’,” Diane explained.
“Nice work Diane, few people would have picked up on that difference,” Patty replied.
“I will tell you that both alloy 3 and 4 had 15 samples to start with in the test. What do you think happened?” asked Patty.
Very quickly, Fred Wilkins raised his hand. Patty nodded to him.
“I’ll bet that two of the samples from alloy 4 did not fail,” Fred suggested.
“Correct!” Patty responded enthusiastically.
“I want you all to take a few minutes to discuss this situation with those seated around you. I then want you to vote anonymously whether the two samples that did not fail make alloy 4 the same, better or worse than alloy 3,” Patty instructed.
After five minutes of noisy discourse, the students voted on a website, the results of which Patty could show on her laptop and project to the class. Twelve students thought the alloys were still the same. 24 thought alloy 4 was better, and 6 thought alloy 4 was worse.
“Any comments on the results?” Patty asked.
There were no takers.
“Let’s assume that the two samples that failed were tested for a much longer time and they finally failed at some very high number of cycles, say 2,000. Let’s look at what the Weibull plot would look like,” Patty said.
She then showed Figure 4.
Figure 4.
“Can anyone explain it?” Patty asked.
After a short time, Young Koh raided his hand.
“Dr. Coleman, the added cycles increased the scale significantly, but ruined the slope, suggesting much more scatter in the data. As you suggested earlier, reliability testing is about hoping to have the ability to predict lifetime. With the large decrease in the slope, prediction becomes much more difficult, So, sample 4 is likely worse than sample 3, even though it has a large scale.” Young expounded.
“Precisely,” Patty answered.
“It is interesting to note that many engineers in the electronics industry today just ignore the samples that don’t fail,” Patty went on.
The class looked at her with shocked faces.
"Well, that's all until next time," Patty said.
"Two of the female students, Jessica Han and Mary Connor, stayed after the class to talk to Patty.
"Professor, there is a rumor that you will be teaching "Manufacturing Processes" next term, is it true?" Mary asked. Then went on, "We really hope so. You are best teacher here."
Patty was so touched she started getting a little misty eyed, "Thank you for your kind comment, but I doubt that that will be the case," she said as her voice quavered.
Will the Dean fire Patty or will she be teaching Manufacturing Processes the next term. Stay tuned to see.
Cheers,
Dr. Ron


